The new Nexus Dashboard brings together multiple aspects of network management into a single unified dashboard. The Network Insights Advisor, which is integrated into the Nexus Dashboard provides the administrator with a machine learning-powered view into the status of network operations and what can be done to help optimize deployments.
"Nexus dashboard represents the state of the art as the most powerful data center, networking management platform ever created," Nightingale said. " It is an incredibly exciting release for us here at Cisco because it brings together, so many products and so much functionality and really delivers insights and the ability to automate data center networks around the world."
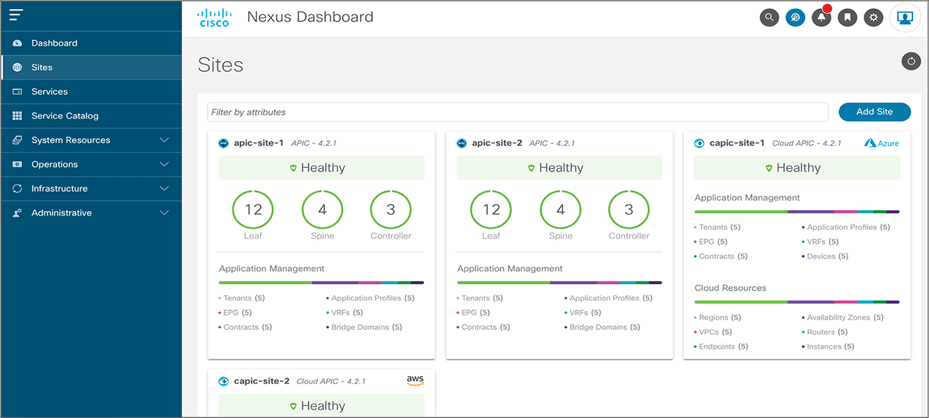
Nexus Dashboard is a centralized management console to access various Day-1 and Day-2 services to operate your data center infrastructure.
Business demands agility. But IT and networking teams have always operated in a reactive, break-fix mode. With the availability of a powerful suite of day-2 operations services from Cisco, operating your infrastructure has never been easier. In addition to providing you with a set of powerful services to operate your intent-based infrastructure, the Cisco Nexus® Dashboard makes it easy and convenient to consume these services.
Imagine you are experiencing issues with a critical service such as Single-Sign-On (SSO). Debugging packet drop, or availability issues are a nightmare, especially if the service footprint spans across data centers. With the Nexus Dashboard, you can easily onboard the sites experiencing problems, install the insights service, and start to observe anomalies and correlate them with policy or dynamic changes in your network. The Nexus Dashboard offers both operator and administrator roles allowing different access controls for operations personnel. With the Nexus Dashboard, you get a unified operations view across all your sites and services.
Reduce operational complexity by standardizing on the Nexus Dashboard. Along with a uniform onboarding experience for sites and operational services such as insights, assurance, and Cisco Multi-Site Orchestrator, the operator now has a single landing page and a consistent user experience to operate the infrastructure. The operator can run different instances of services for multiple sites and quickly root cause issues. A quick glance informs the operator of the health of the various sites and the infrastructure services. And Nexus Dashboard has easy-to-navigate panels and dashlets if the operator wants to get a specific view.
Are your network operations teams armed with the right tools to avoid costly downtime, meet business SLAs, and address scale for geographically distributed data centers? Are they dealing with screen sprawl as they try and stitch capabilities together? Try the Nexus Dashboard today to address your network operations challenges from a single pane of glass.
To learn more check out the At-a-glance, and demo video: